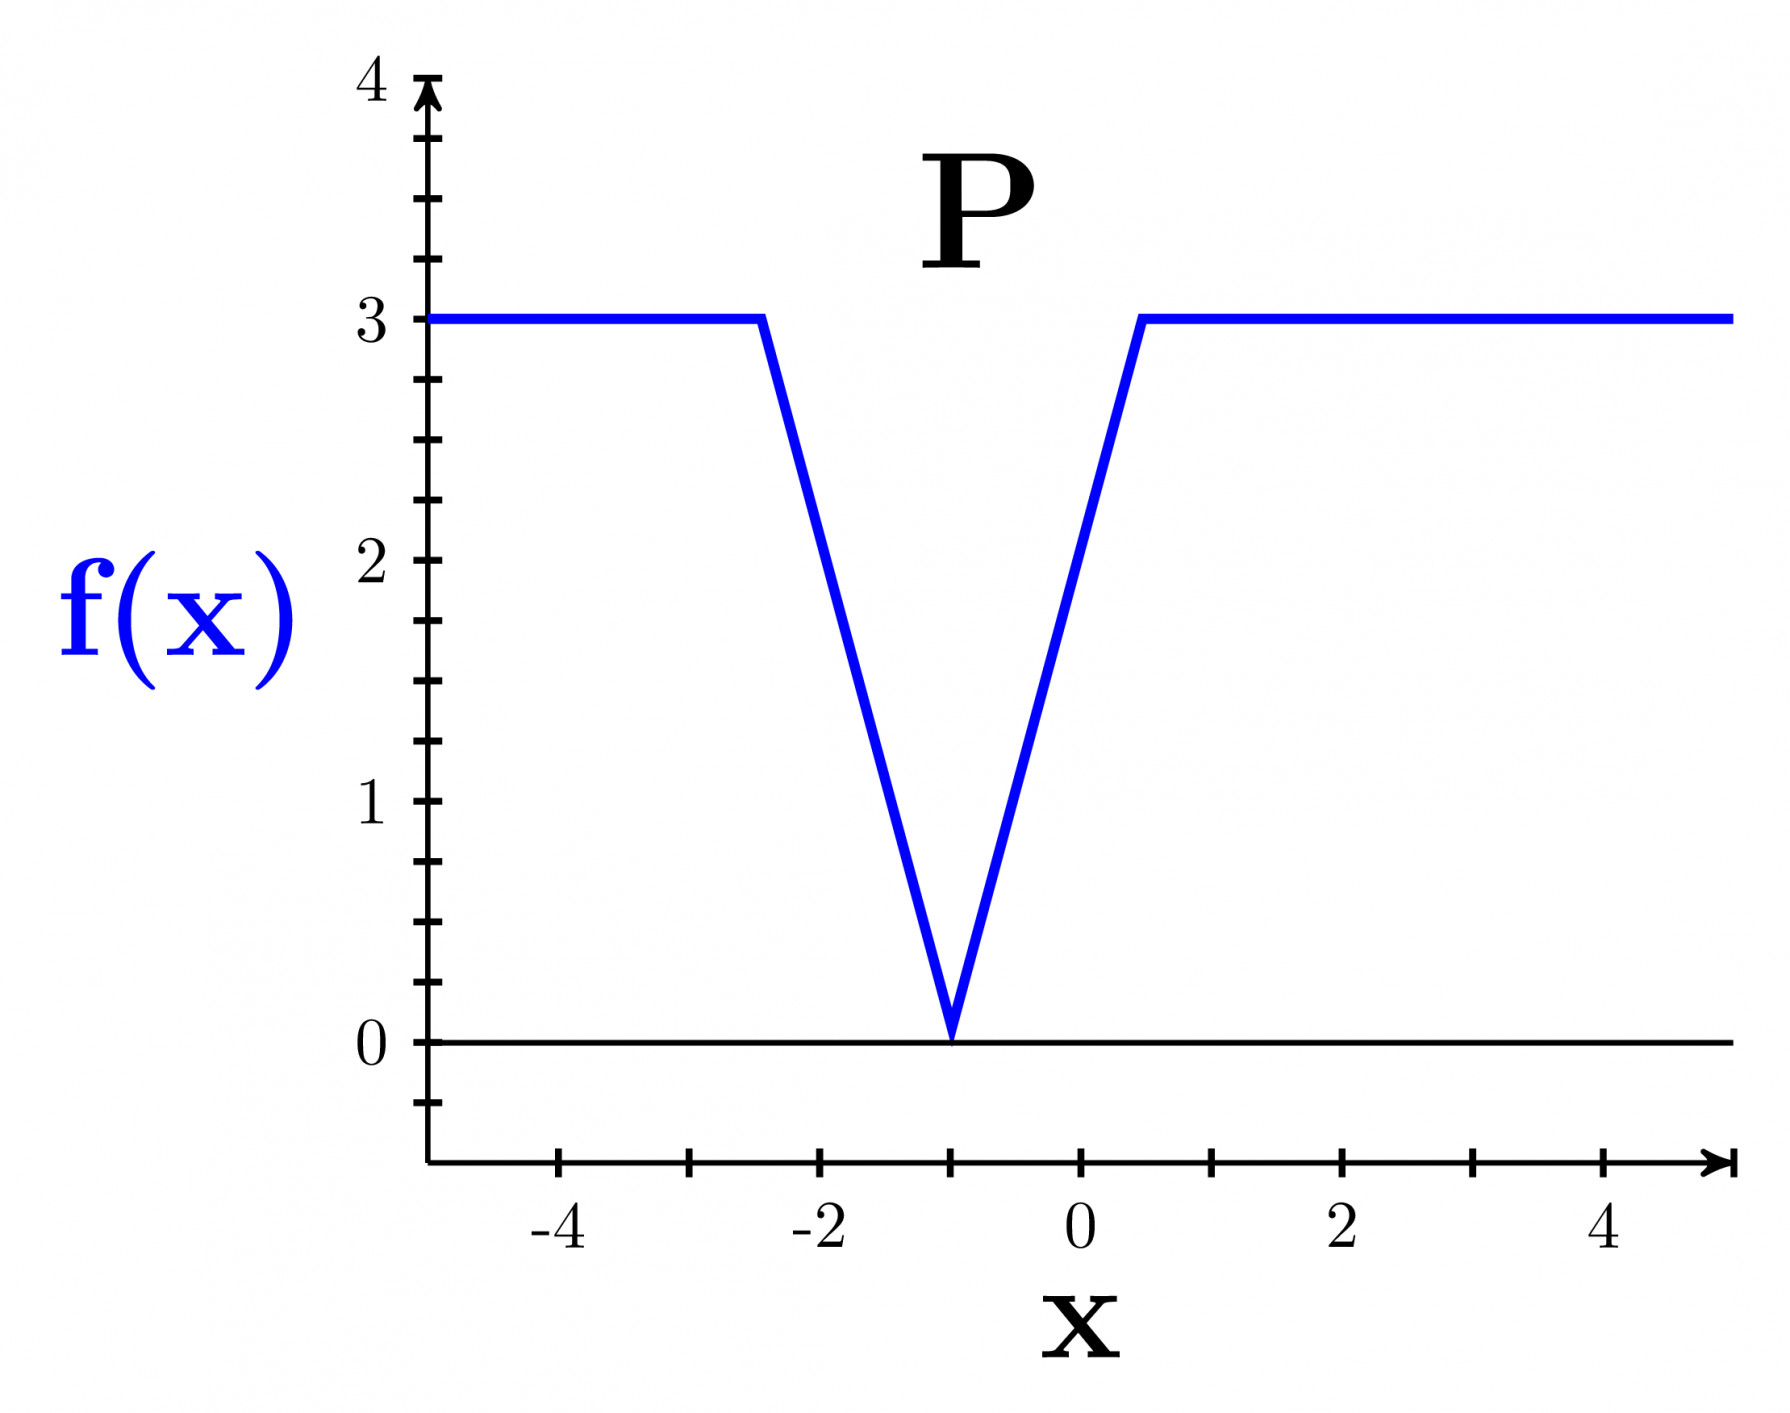
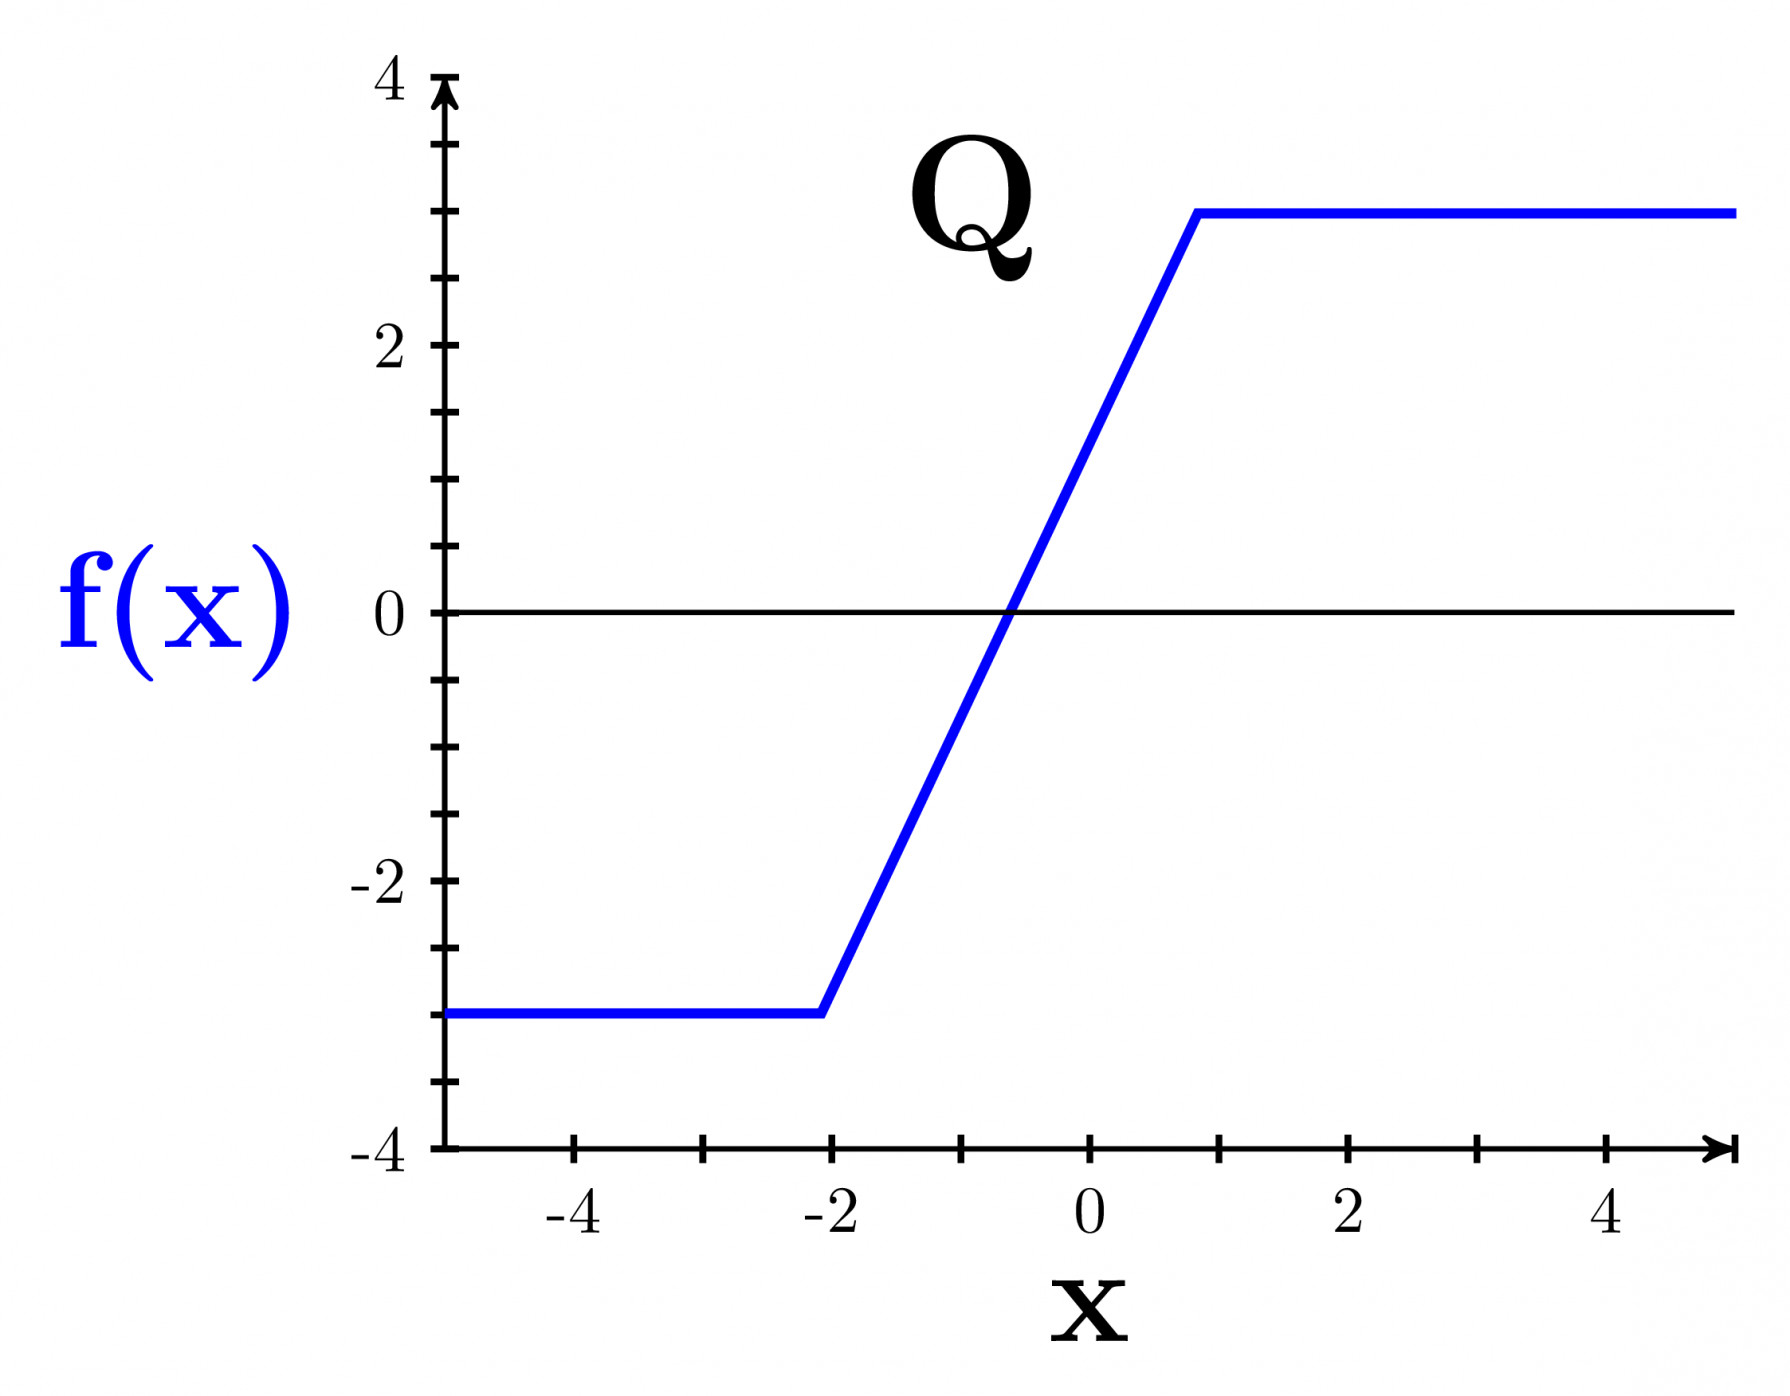
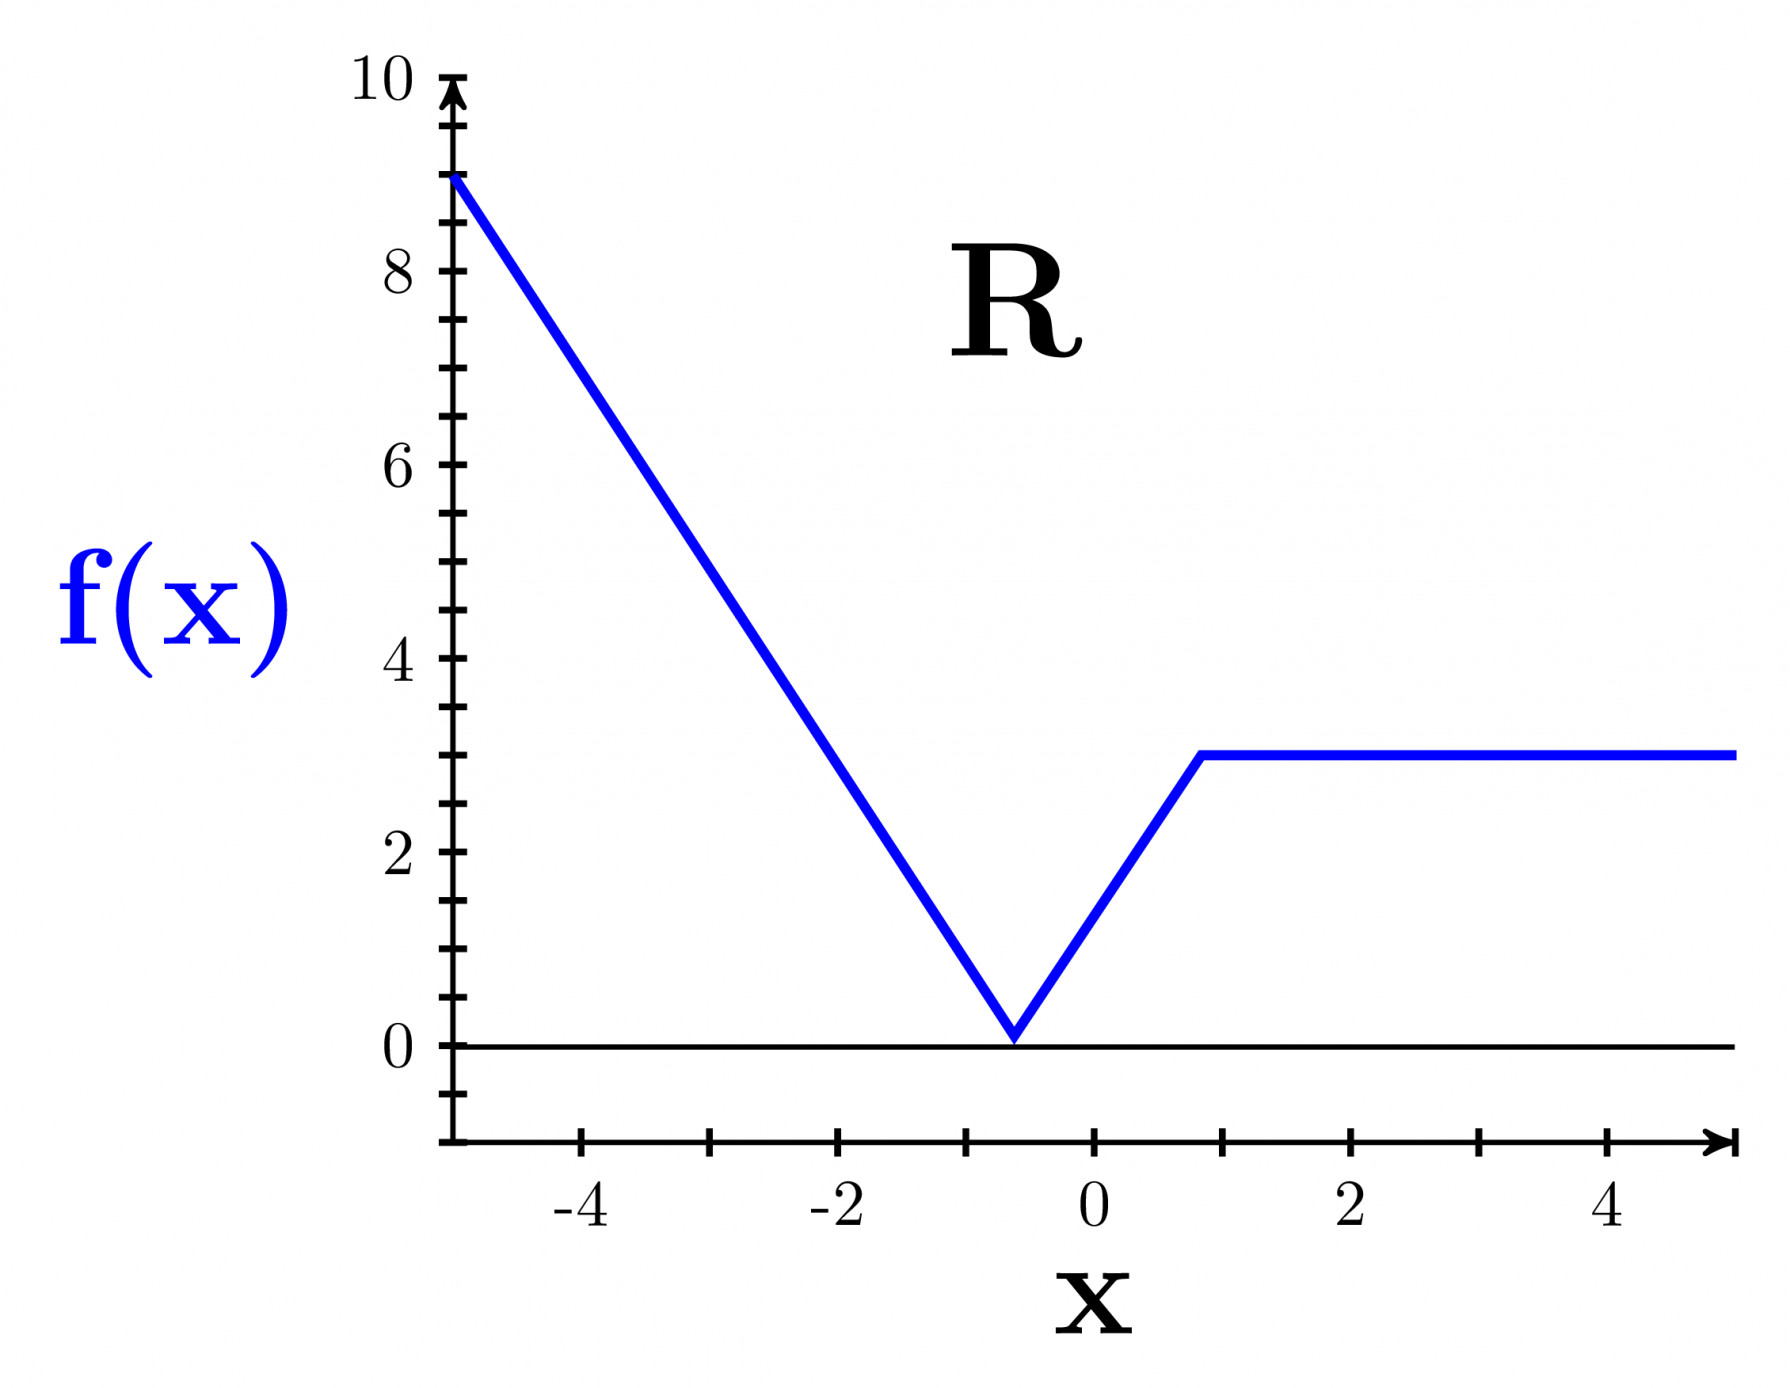
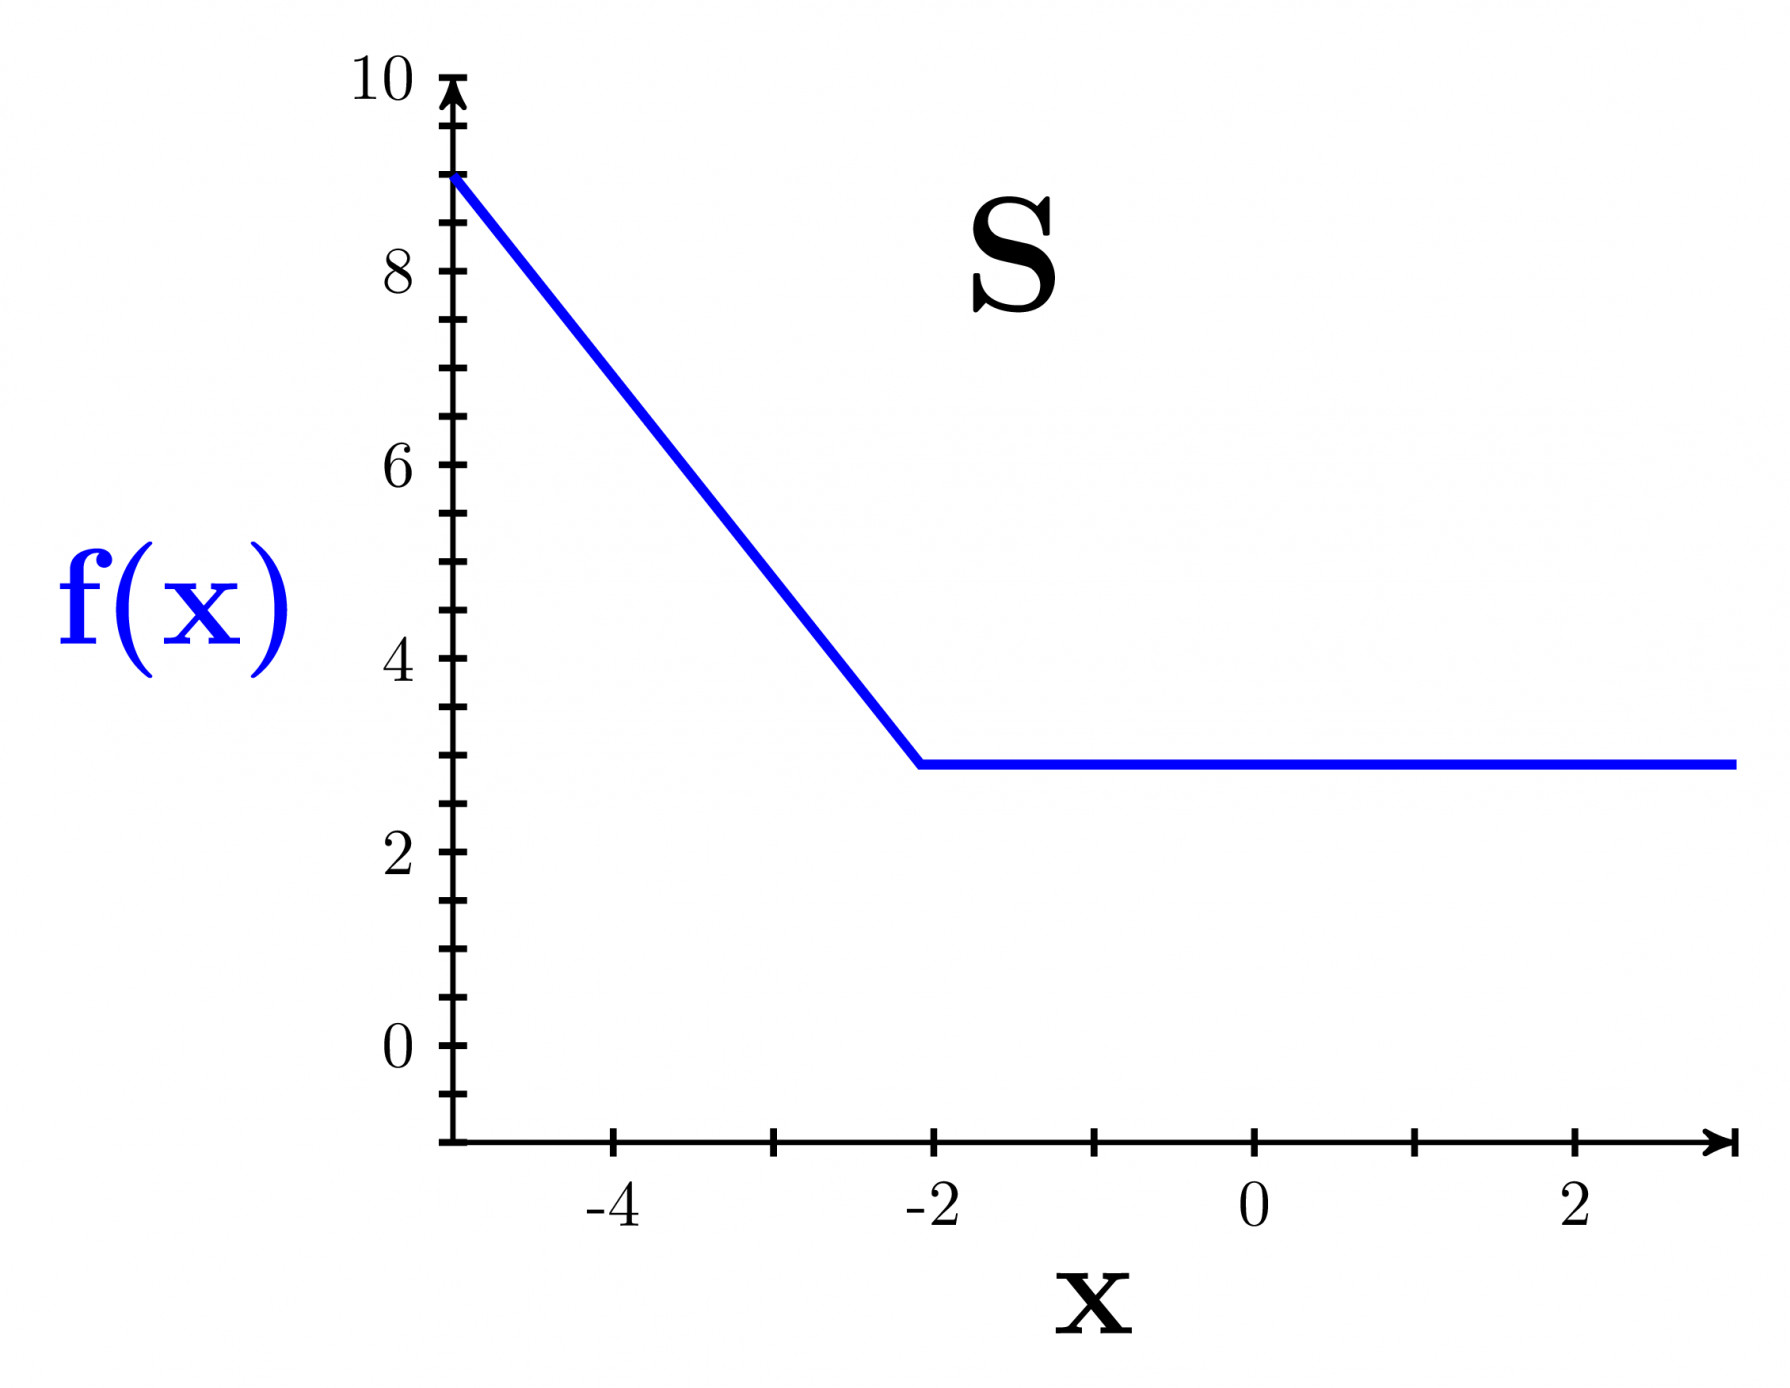
1 votes 1 votes Which one of the given figures $\text{P, Q, R}$ and $\text{S}$ represents the graph of the following function? $$f(x)=|| x+2|-| x-1||$$ $\text{P}$ $\text{Q}$ $\text{R}$ $\text{S}$ Quantitative Aptitude gatein-2023 quantitative-aptitude absolute-value + – admin asked May 22, 2023 • edited Sep 23, 2023 by Arjun admin 2.7k points answer See all 0 reply