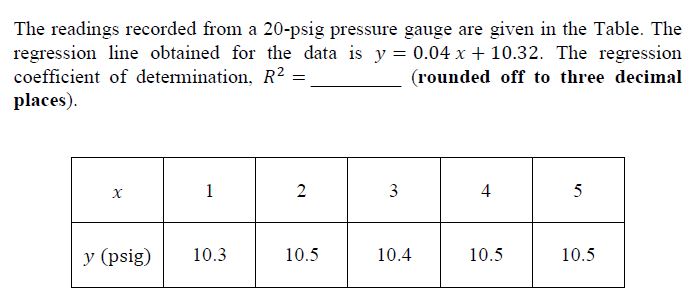
The readings recorded from a 20 -psig pressure gauge are given in the Table. The regression line obtained for the data is $y=0.04 x+10.32$. The regression coefficient of determination, $R^{2}=$ (rounded off to three decimal places).
\begin{tabular}{|c|c|c|c|c|c|}
\hline$x$ & 1 & 2 & 3 & 4 & 5 \\
\hline$y$ (psig) & 10.3 & 10.5 & 10.4 & 10.5 & 10.5 \\
\hline
\end{tabular}