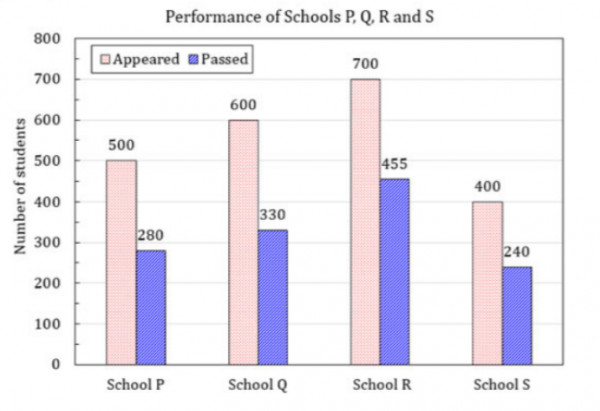
0 0 votes The bar graph shows the data of the students who appeared and passes in an examination for four schools $\text{P, Q, R and S.}$ The average of success rates (in percentage) of these four schools is _________. $58.5\%$ $58.8\%$ $59.0\%$ $59.3\%$ Quantitative Aptitude gate2020-in numerical-ability data-interpretation bar-graph + – soujanyareddy13 2.7k points answer 0 reply